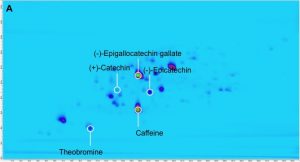
LC analyses were performed using an Agilent 1290 Infinity II 2D-LC solution, deploying reversed-phase LC in both the first and second dimension. For this separation, an Agilent ZORBAX Eclipse plus C18 LC column was used for the first dimension and an Agilent Poroshell 120 Bonus-RP for the second dimension. Detection was achieved using an Agilent 1290 Infinity II diode array detector.
Method Validation
Figure 1 shows the separation of a 10 micrograms (μg) per mL mixture of the purine alkaloids, caffeine, theobromine, and theophylline as well as the catechins, catechin, epicatechin, and epigallocatechin gallate. For this complex mixture, 2D-LC setup enables a complete separation of the purine alkaloids and catechins. In the first-dimension separation, a coelution of caffeine and epigallocatechin gallate is observed, which is resolved in the second-dimension separation. Deploying only the second-dimension separation, catechin and epicatechin would coelute.
The precision of retention times and peak volumes were determined following multiple injections of this 10 μg per mL mixture of purine alkaloids and catechins (n=10). For these compounds, the second-dimension retention time precision was always below 2.5 percent and the peak volume precision was below 1 percent. These results demonstrated that the resolution and precision of 2D-LC is sufficient for the analysis of complex chemical compositions.
To quantify the levels of purine alkaloids and catechins in green and black tea, calibration curves were produced from each of the standard stock solutions. The response of caffeine, theobromine and theophylline, catechin, epicatechin, and epigallocatechin gallate at concentrations ranging from 2 to 100 µg per mL was measured. The coefficients of linearity produced for the purine alkaloids and catechins are shown in Table 1, confirming the excellent linearity achieved.
Analysis of Green and Black Tea Samples
Example chromatograms produced from a 2D-LC separation of one black tea sample and one green tea sample are shown in Figures 2a and 2b. Theophylline could not be detected in any of the analyzed tea samples. In green tea, the epigallocatechin gallate peak shows at a much higher intensity compared to black tea. In black tea, there are several peaks detected at retention times between 30 to 32 minutes in the first-dimension that are not visible in green tea. These peaks could originate from theaflavins and thearubigins present in black tea.
Ten different samples of green and black tea were analyzed, and Graph 1 shows the quantification results for purine alkaloids and catechins. As expected, the green tea samples generally contain higher amounts of the catechins epigallocatechin gallate and epicatechin than the black tea samples. This difference is due to the longer fermentation period used in the production of black teas. In which the monomeric catechins undergo oxidation polymerization to form theaflavins and their polymers thearubigins.

Graph 1. Quantification of purine alkaloids and catechins in green and black tea.
Image Credit: Agilent Technologies
Summary
This experiment demonstrates that a range of key phenolic compounds in complex tea samples can be separated using the resolving power of 2D-LC. This allowed precise assessment of the degree to which the catechins, epigallocatechin gallate, and epicatechin dominate in green tea samples in comparison to black tea samples. In comparison to 1D-LC, this 2D-LC approach revealed more information about the nature of black tea through the resolution of several peaks not significant in green tea.
ACCESS THE FULL VERSION OF THIS ARTICLE
To view this article and gain unlimited access to premium content on the FQ&S website, register for your FREE account. Build your profile and create a personalized experience today! Sign up is easy!
GET STARTED
Already have an account? LOGIN


